Loggy's Horror Mark research notes (Data analysis)
I'm still working on this, just writing a narrative to help guide what next.
Internally, hosting has 3 horror attack phases:
1) Normal horror attacks 2) Eater of gods, which targets only gods 3) Hunter of heroes, which targets only people famous enough (though I don't know what defines this)
I mostly concerned myself with case 1, and did a little on case 2. I haven't touched 3 at all, yet. In my data I could distinguish these cases by the debug log's hosting messages.
Test setup involved commanders with 100% tainted startitems (guaranteed to yield +1 horror mark per turn). I had the item have a startbattlespell which instantly kills everything, but some horrors with damage reversal could survive this. The horrormarked chassis was buffed appropriately to resist that. Then I simply hosted the turn "enough" times to gather data, reading the debug log to see what attacked who.
This means that some horrors got into melee and used their horror marking weapons to mark my test guys more, giving the wide range of mark numbers observed.
Note also that my script is slightly flawed which has it underread values in some cases. In these cases it is usually consistent with all iterations of a given turn.
Graphs are 95% CI using Wilson intervals unless otherwise noted. This has the side effect of altering data points from their calculated values: this can for instance make it look as though the chance of a lesser horror attack starts to increase where the data gets sparse at high mark counts, whereas in reality this is just an effect produced by the interval.
Type 1 attacks (normal horror eating horror marked guy)
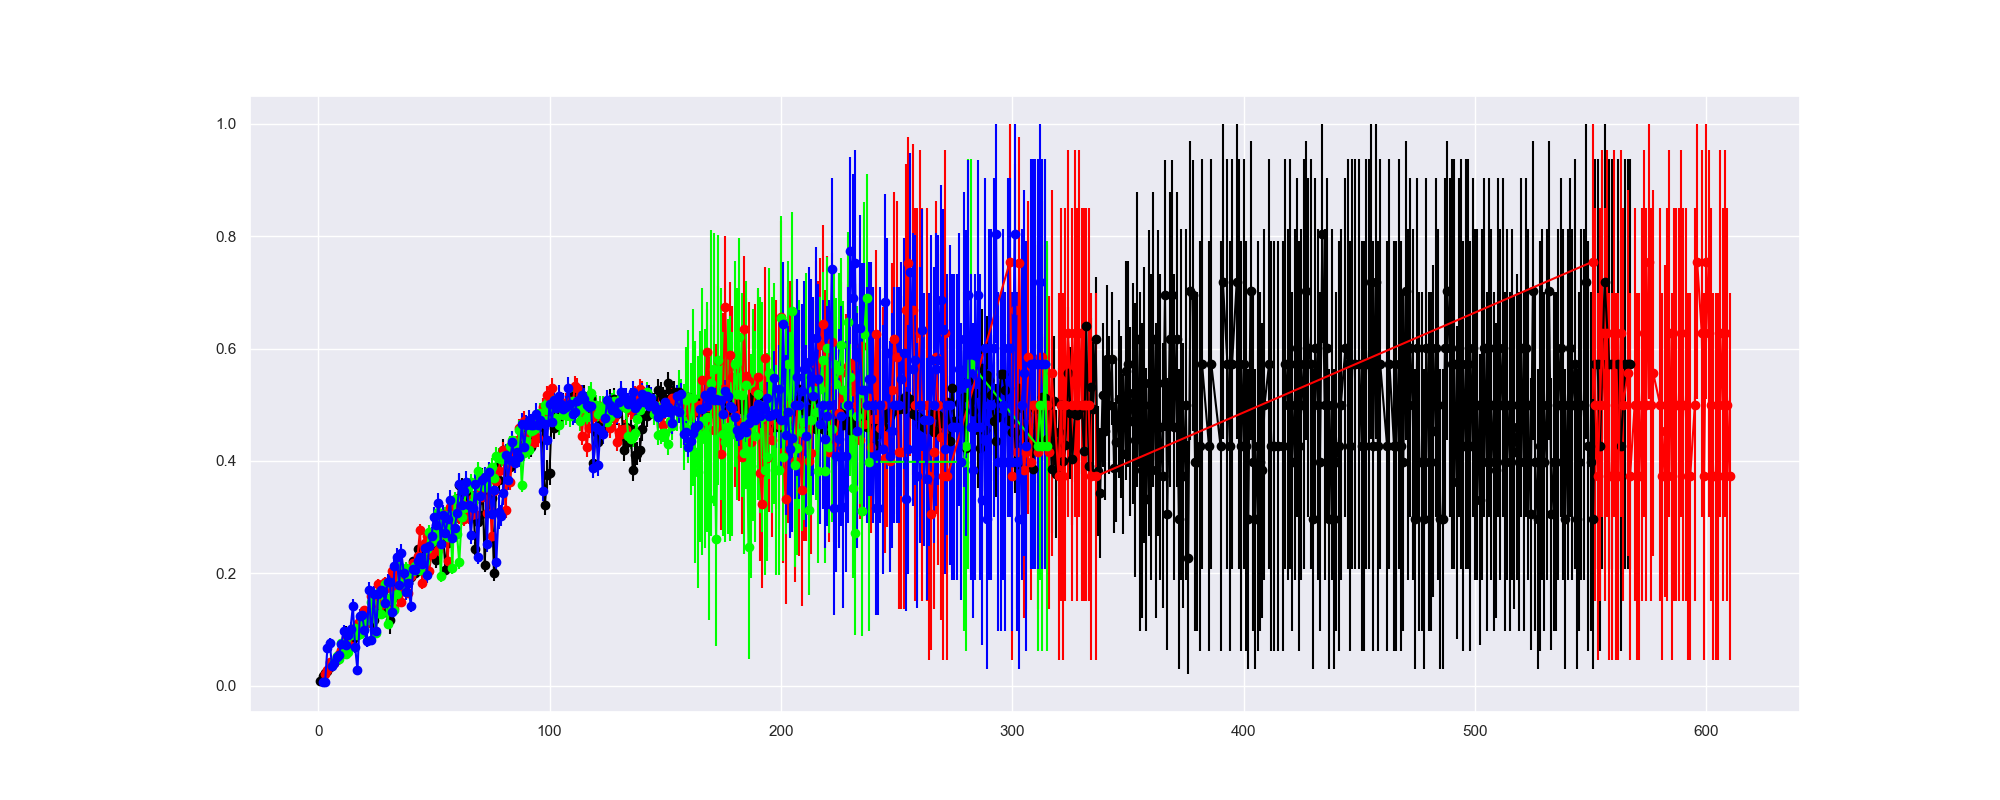
These look to be 0.5% per mark per turn, up to a maximum of 50% at 100 marks. This chart (attack chance vs number of marks for all datasets) has hideous colours but hopefully illustrates that passably:
Then, it was time to look at the different tiers of horrors. The following is the largest dataset, for neutral scales:
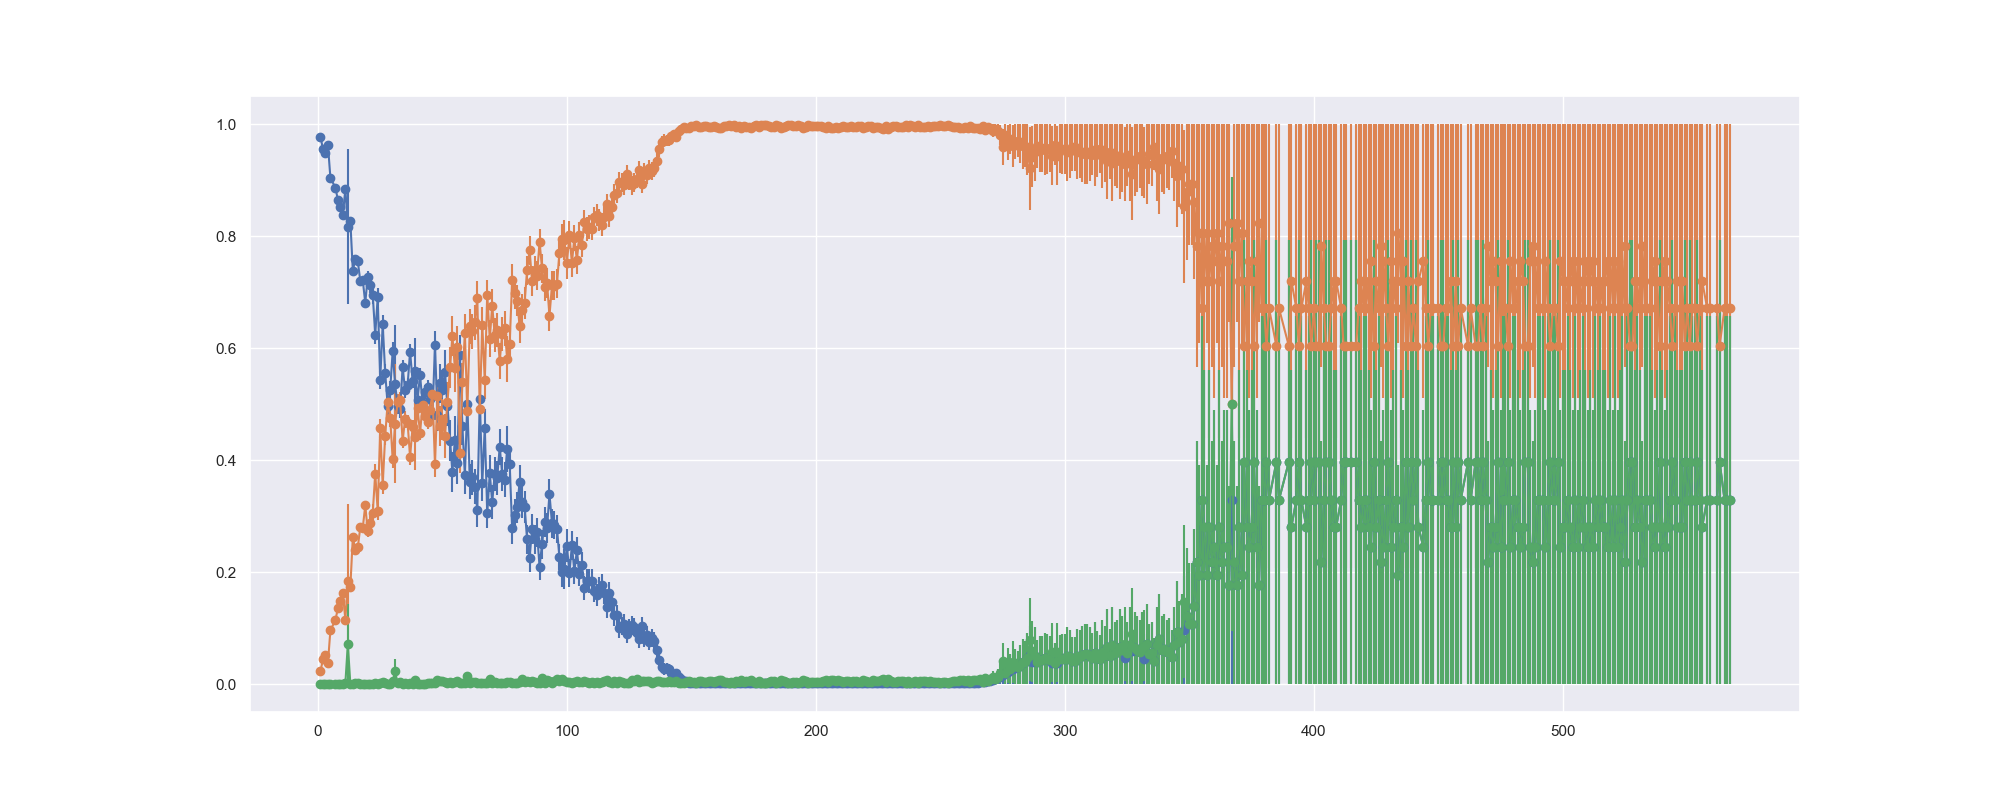
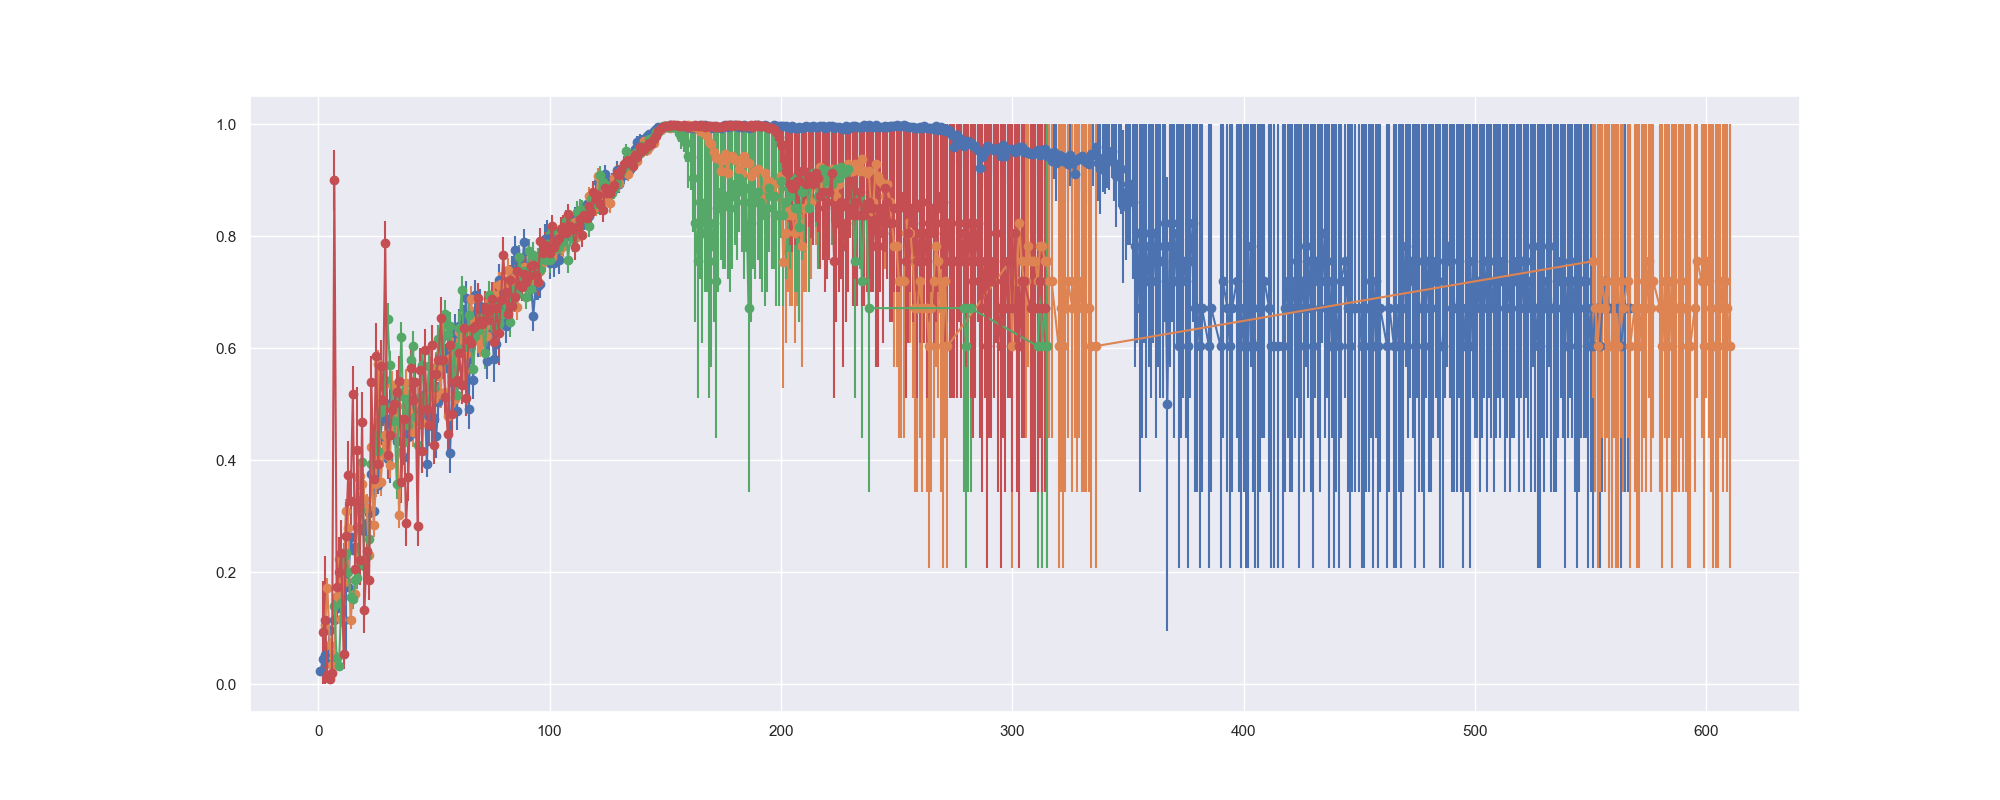
Blue: lesser; orange: greater; green: doom. All scales sets look roughly the same, for the sake of brevity, here is the overlayed greater attack chances for each set:
All that remained then was to deal with doom horrors (which appear as flat as they look on the above) and work out some expression for the greater and lesser horrors. I fully expected to need to pull out some kind of nonlienar regression for this, but upon further analysis it looks like the greater/lesser chances can be approximated as two linear expressions, with the joining point at around 25 marks.
Specifically, the greater rate appears to be 40% at 25 marks, increasing to 100% at 150 marks. The lesser rate is simply the inverse of this (well, besides the doom horror rate…)
Doom horror attacks are RARE and seem to not vary with number of marks (though they might, but not very much if they do). Thus, I pooled all my data to calculate the doom attack rate, as accurate as it can be with so few compared to the others…
Doom has 1825 out of 1237578, rate is 0.0014746545268257839
I don't think it's unreasonable to call that ~0.15%.
Type 2 attacks (eater of gods)
First off, it looks like gods get the normal attacks and the chance of the eater coming to eat them is just a cherry on top.
Second, at least in my testing conditions this is probably a flat line. This takes SO LONG to test which means my data is horrendously noisy, and my patience with running this particular test grows pretty thin… :(
Eater attacks: 3089 in 49340, 0.06260640453992704
~6%?
Disassembly puts this at 5% when no AC or cataclysm are active.
Reduction when dead
It's a flat 10% per turn, rounding down, and reducing a minimum of 1 mark per turn but never to 0.